A maintenance programme is written once and then runs for years while the plant changes around it. PM optimisation is the loop that closes that gap — comparing what the plan says against what actually happened, and changing the plan where the evidence supports it.
NORSOK Z-008:2024 splits this into two clauses that this tool keeps strictly apart. §11.4 lists what should make you investigate. §11.5 lists what justifies changing the programme. They are not the same list, and a repeated failure is a reason to find out why, not a reason to shorten an interval.
You upload three exports — the plan register, PM completion history, failure history — and get a verdict per plan line with the clause, the sample size and the attribution behind it. It is free, it runs in your browser, and nothing is uploaded anywhere.
Why programmes drift
Almost every preventive maintenance programme starts life as a reasonable set of assumptions: the vendor’s recommended intervals, a criticality study, and whatever the last plant did. Those assumptions were made before the equipment ran a single hour.
Then the plant runs. Some tasks turn out to be finding nothing, year after year. Some assets fail far more often than their identical siblings. The floor quietly settles into a rhythm that is not the one written on the plan. None of this shows up in a report, because a maintenance programme has no natural feedback loop — a PM that finds nothing looks exactly like a PM that was worth doing.
Z-008 puts the obligation plainly. §11.5: “A maintenance program shall be reviewed and updated at regular intervals. A continuous improvement process shall be in place in order to enhance safety levels and, at the same time, reduce equipment downtime and OPEX.” That is a shall. The difficulty was never whether to do it; it is that doing it by hand across a few thousand plan lines is a job nobody has time for.
The two clauses that decide everything
This is the part most PM optimisation exercises get wrong, and it is worth being pedantic about because it changes what you are allowed to conclude.
Triggers for investigation
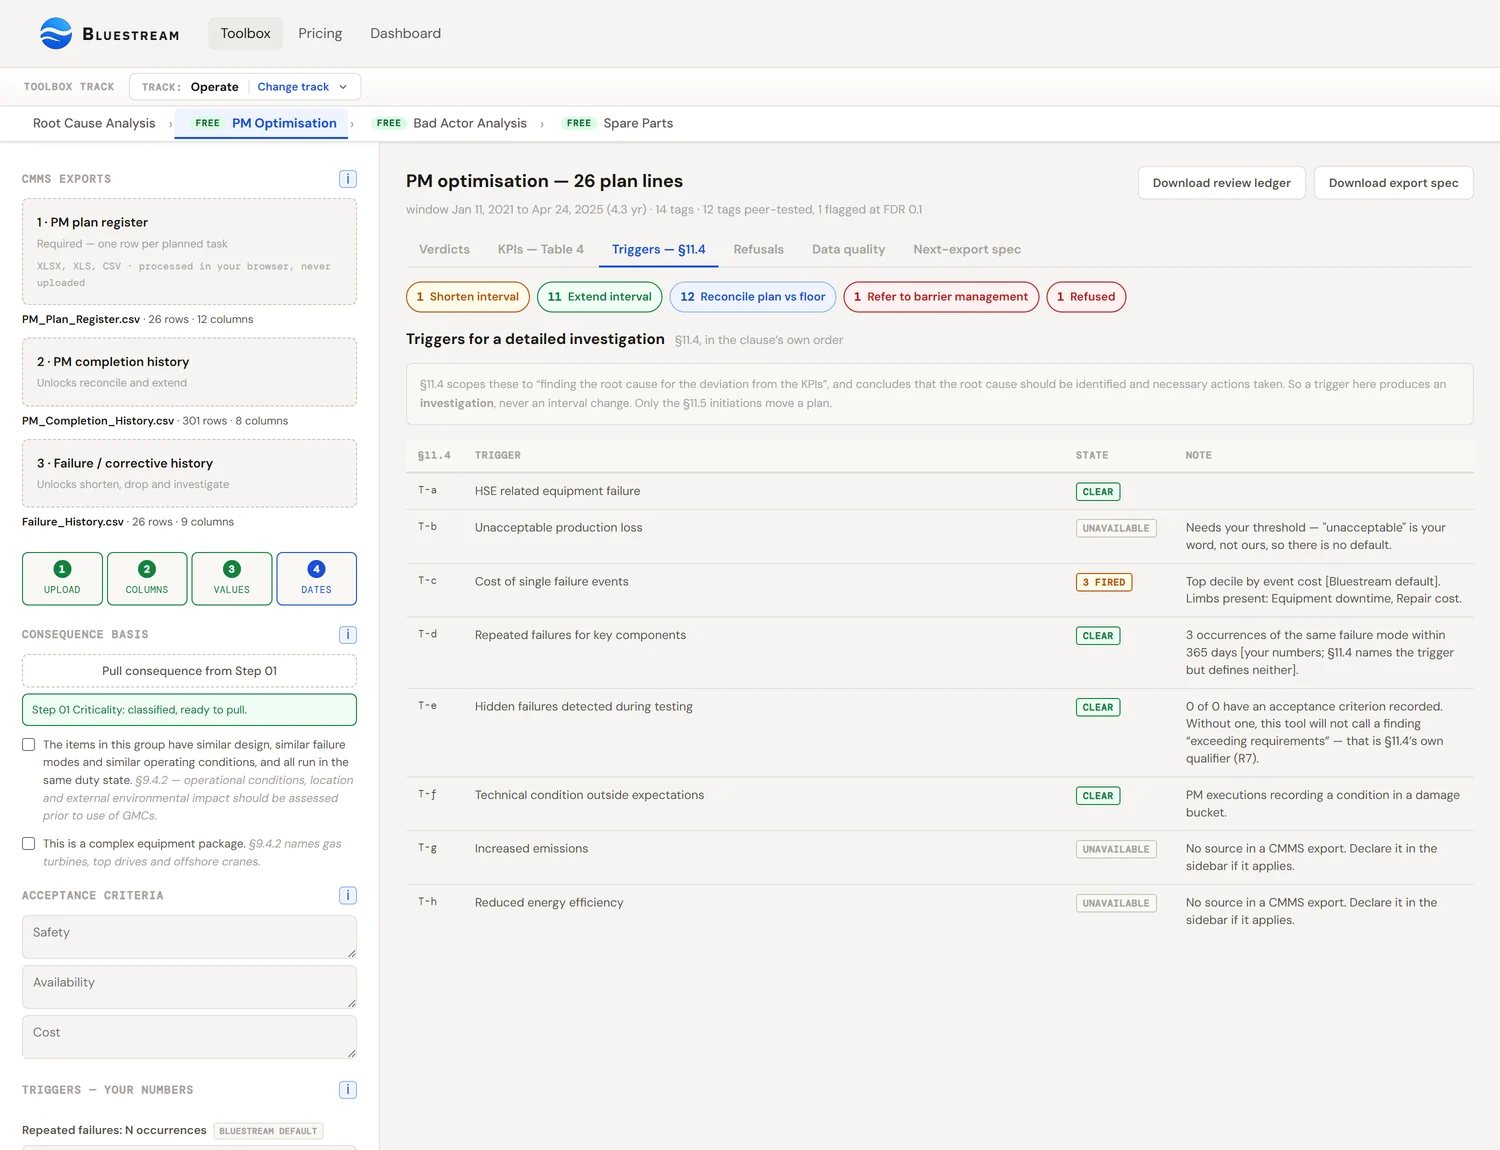
Eight of them, from HSE-related equipment failure to reduced energy efficiency. The clause scopes them to “finding the root cause for the deviation from the KPIs” and concludes that the root cause should be identified and necessary actions taken.
Initiations for a programme update
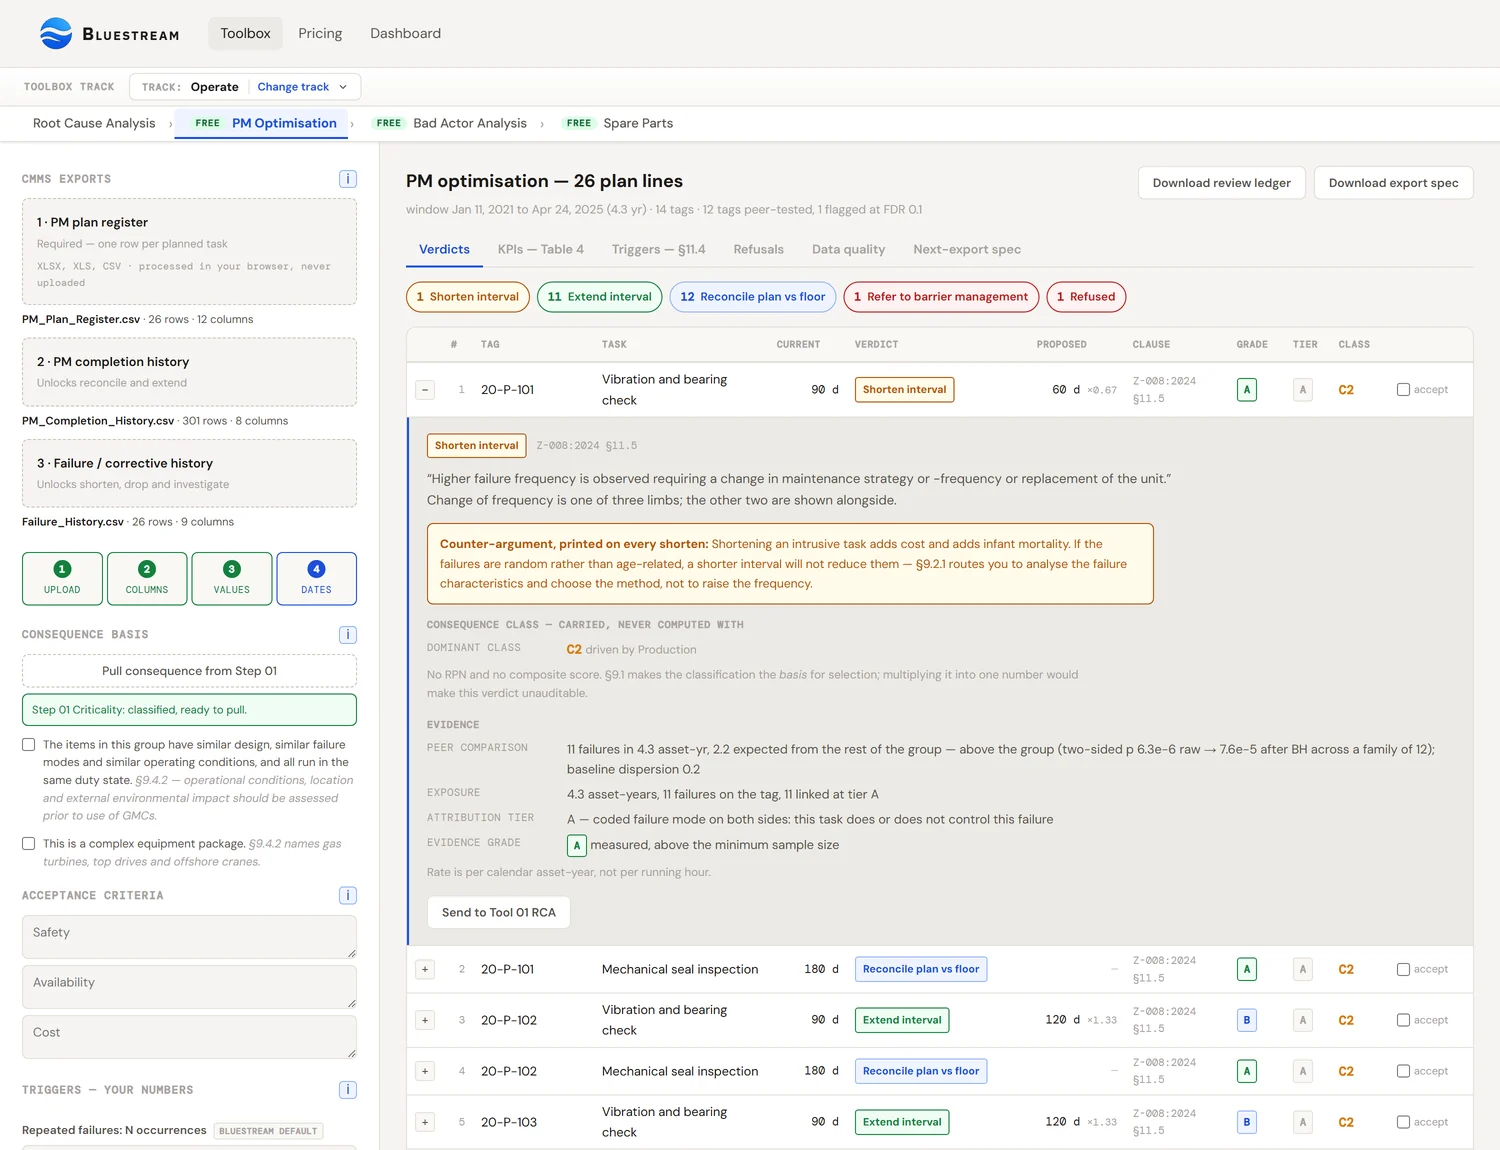
Seven bullets this time, and the first splits into two opposite limbs — eight initiations in all. Only two are visible in a CMMS export: a higher observed failure frequency, and a lower one or no observed damage at PM. The other six are things a human declares.
The distinction matters because the natural instinct — “this pump keeps failing, shorten the interval” — jumps straight from a §11.4 trigger to a §11.5 action, skipping the step where you find out why it keeps failing. If the cause is misalignment at installation, a shorter inspection interval buys nothing and costs money.
So in this tool, nothing on the trigger register moves an interval — it produces an investigation and stops there. Every verdict card carries a button that hands that line straight to Root Cause Analysis, which is where a repeated failure belongs before anyone argues about its interval.
What you upload
Three exports. Only the first is required, and the tool tells you which analyses each one unlocks before you run it rather than leaving you to discover the gaps afterwards.
| Export | What it is | What it unlocks |
|---|---|---|
| PM plan register required | One row per planned task: tag, interval, ideally a task id and a maximum allowed interval. | Interval conformance, and the refusal register. |
| PM completion history | Completed preventive orders with dates, and ideally the condition found. | Reconcile plan against floor; the “no damage at PM” extension limb. |
| Failure / corrective history | Corrective orders or notifications with a failure date, ideally coded. | Shorten, drop, and the §11.4 triggers. |
§11.2 names the fields worth having, reprinting Table 3 from NS-EN ISO 14224:2016 — failure date, mode, mechanism, cause, impact, operating condition and detection method on one side; maintenance category, condition before and after, man-hours, spares, start and finish, active maintenance time and downtime on the other. Real exports carry perhaps half of that. The clause itself allows for this: the required reporting “will vary between systems and equipment and focus shall be on safety critical and production critical items”.
So a gap is not a conformance failure. It is a list of analyses that stay switched off, and the tool prints that list, plus a specification you can hand to whoever pulls the next export.
Nothing leaves your browser. The spreadsheets are parsed in the page. There is no upload, no server-side analysis and no model in the loop — every number in the output can be re-derived by hand from the exported CSV, which matters when someone in the review meeting decides to check one.
The verdicts
Each plan line gets exactly one, with the clause it rests on printed beside it.
| Verdict | Rests on | When |
|---|---|---|
| Keep | — | No §11.5 initiation is met. Shown with its evidence anyway — a silent keep is an unreviewed line. |
| Reconcile plan vs floor | §11.5 | The plan says six months and the floor does nine. Decide which one you mean before optimising either. |
| Extend interval | §11.5 | Lower failure frequency than the peer group, or no damage found at PM — and every gate below is passed. |
| Shorten interval | §11.5 | Higher failure frequency than the peer group, on failures actually linked to this task. |
| Change strategy | §9.1, §11.5 | A calendar task where the concept says condition-based, or a hidden failure with no function test. |
| Replace the unit | §11.5 | Shortening would drive the interval below the shortest sensible rung. The same clause bullet allows it. |
| Drop to planned corrective | §9.2.1 | The clause permits it where no PM is required or cost-effective — may, not shall, and the card says so. |
| Add task | §9.2.2, §9.3, §9.4.2 | A concept line with nothing covering it, an unsafe failure mode with no task, or a barrier with no function test. |
| Investigate | §11.4 | From the trigger register only. Never touches an interval. |
| Insufficient evidence | — | Names the exact field that would change the answer. Expect this to be the commonest verdict on a first upload. |
Reconcile is the one that always works
It needs only a tag, a task and some dates — no failure coding, no condition field, no criticality study. And it is often the most valuable thing in the run, because a plan that says 180 days against a floor that runs at 270 is not an optimisation problem yet. It is a disagreement about what the programme actually is, and no interval arithmetic on top of it means anything until it is settled.
Earning an extension
§11.5’s second observable initiation reads: “lower failure frequency or no observed damage at PM can point towards extension of intervals or omitting certain tasks.” Two limbs, and the tool requires one of them plus a set of gates.
- Limb A — lower failure frequency. Needs a comparison, not an absence. An empty failure column is not evidence of reliability; it is evidence of an empty column. The tool compares the tag against its own peer group.
- Limb B — no observed damage at PM. Needs the condition-found field that §11.2 Table 3 names in its own right, and enough clean executions to mean something.
Then the gates: a consequence class to select against, a maximum allowed interval to stop at, enough observed cycles, not a safety-driven item, not a hidden-failure function test, and no bulk close-out in the data. The asymmetry is deliberate and the panel says so: it is much harder to earn an extension than a shortening, because absence of evidence over a short window is not evidence of reliability.
A clean function test is not good news about the interval. For a hidden failure, a clean test is the expected outcome — that is what hidden means. A run of them tells you the item has not failed, not that you can test it less often. The defensible bound is a tolerable multiple-failure probability from barrier analysis, which this tool does not hold and will not guess at. It refuses.
What it refuses, and why
The refusals are a first-class output, not error handling. They are listed on their own tab with counts, and each names the clause that forces it — or says plainly that it is a Bluestream rule rather than the standard’s.
- No consequence class, no interval verdict. §9.1: the classification “shall be used as a basis for the selection of the maintenance activities and –intervals”. No basis, nothing to select from. Run Step 01 first, or supply the column.
- No cost argument on a safety item. §9.2.1 scopes the cost-benefit route to failure modes not critical to the function and items without significant effect on safety or environment. Those lines go to barrier management instead.
- No extension it cannot bound. §9.4.1 requires a generic maintenance concept to carry a recommended and a maximum allowed interval. Where you supply no maximum, the tool prints the recommendation it cannot bound and stops. This is the tool’s defining refusal.
- No interval band read as a number. A cell reading “1–5 Years” is a range, not a period, and is excluded rather than silently read as five years.
- No PFDavg. §11.3 requires targets for the unavailability of safety-critical equipment to come from risk- and barrier analysis. We hold neither yours nor a barrier model.
- No projection past the window. §9.5 warns that most programmes assume a constant failure frequency and so miss ageing. A fitted curve would disguise that rather than fix it.
There is also no OREDA benchmark. The comparisons this tool makes are against the peer group inside your own fleet and against the Bluestream concept library — which for a question about your plant is better evidence than a population average anyway.
The statistics, plainly
Z-008 supplies no formula for any of this. Every number below is a Bluestream choice, and the method note in the tool labels each one as such.
A tag is compared against the rest of its own peer group, leaving itself out of the baseline — otherwise a bad actor inflates the very average it is being judged against. The comparison is an exact conditional test rather than a rate against an estimated average, because on groups of a dozen the average is itself uncertain and pretending otherwise overstates the result.
Then the correction that most exercises skip. Testing twelve tags at the usual five per cent and reporting the hits is twelve tests, not one. Simulate a fleet where every tag genuinely shares one failure rate — so every flag is a false positive by construction — and that rule still raises at least one bad actor in roughly a third of runs; on a group of thirty tags, in more than half. Correcting for the size of the family removes most of that. Exactly how much depends on how the correction is arranged — which turns out to matter more than it sounds.
One test per tag, not two
There is one question per tag — does this tag differ from its peers? — so there is one test, and it is two-sided. Whether the tag sits above or below the group is read off afterwards from the smaller tail. It costs nothing extra, because a tag cannot be in both tails at once.
Asking the two questions separately instead — is it higher, and is it lower — and acting on whichever fires is a two-sided test at double the level, whether or not anyone says so. This tool did exactly that until August 2026: it corrected the two directions as two separate families and then reported a single family size, which described neither. On the simulated fleet above, that arrangement produced at least one false recommendation in 4.4–8.5 % of runs against 2.1–4.1 % after the fix, depending on group size and window length.
That is not free, and it would be dishonest to present it as free. The cost lands on marginal findings: a tag failing at three to four times its group’s rate is now detected about seven percentage points less often. The gap narrows to roughly two points at six times the group rate, and to nothing measurable at eight — a severe bad actor is caught exactly as readily as before. Halving the rate of unnecessary interventions is worth that trade, because a shorten verdict is not free either: it buys more intrusive work, more infant mortality, and a maintenance budget spent on a tag that was never the problem.
The card prints the raw p and the corrected one, with the size of the family it was corrected against. The corrected value on its own cannot be checked: it would not tell you whether a finding was strong in its own right or only survived because the family happened to be small. The one-sided tail for the reported direction, if you want it, is exactly half the raw figure.
Where zero failures were observed, no rate is reported as 0.00. An upper bound is printed instead, because zero failures in a short window and zero failures in a long one are not the same claim.
Measuring the programme
§11.3 asks for KPIs and offers Table 4 as examples — the clause’s own word, and the panel repeats it rather than presenting them as required outputs. The tool reproduces all seven rows with the standard’s own purpose and comment text beside each.
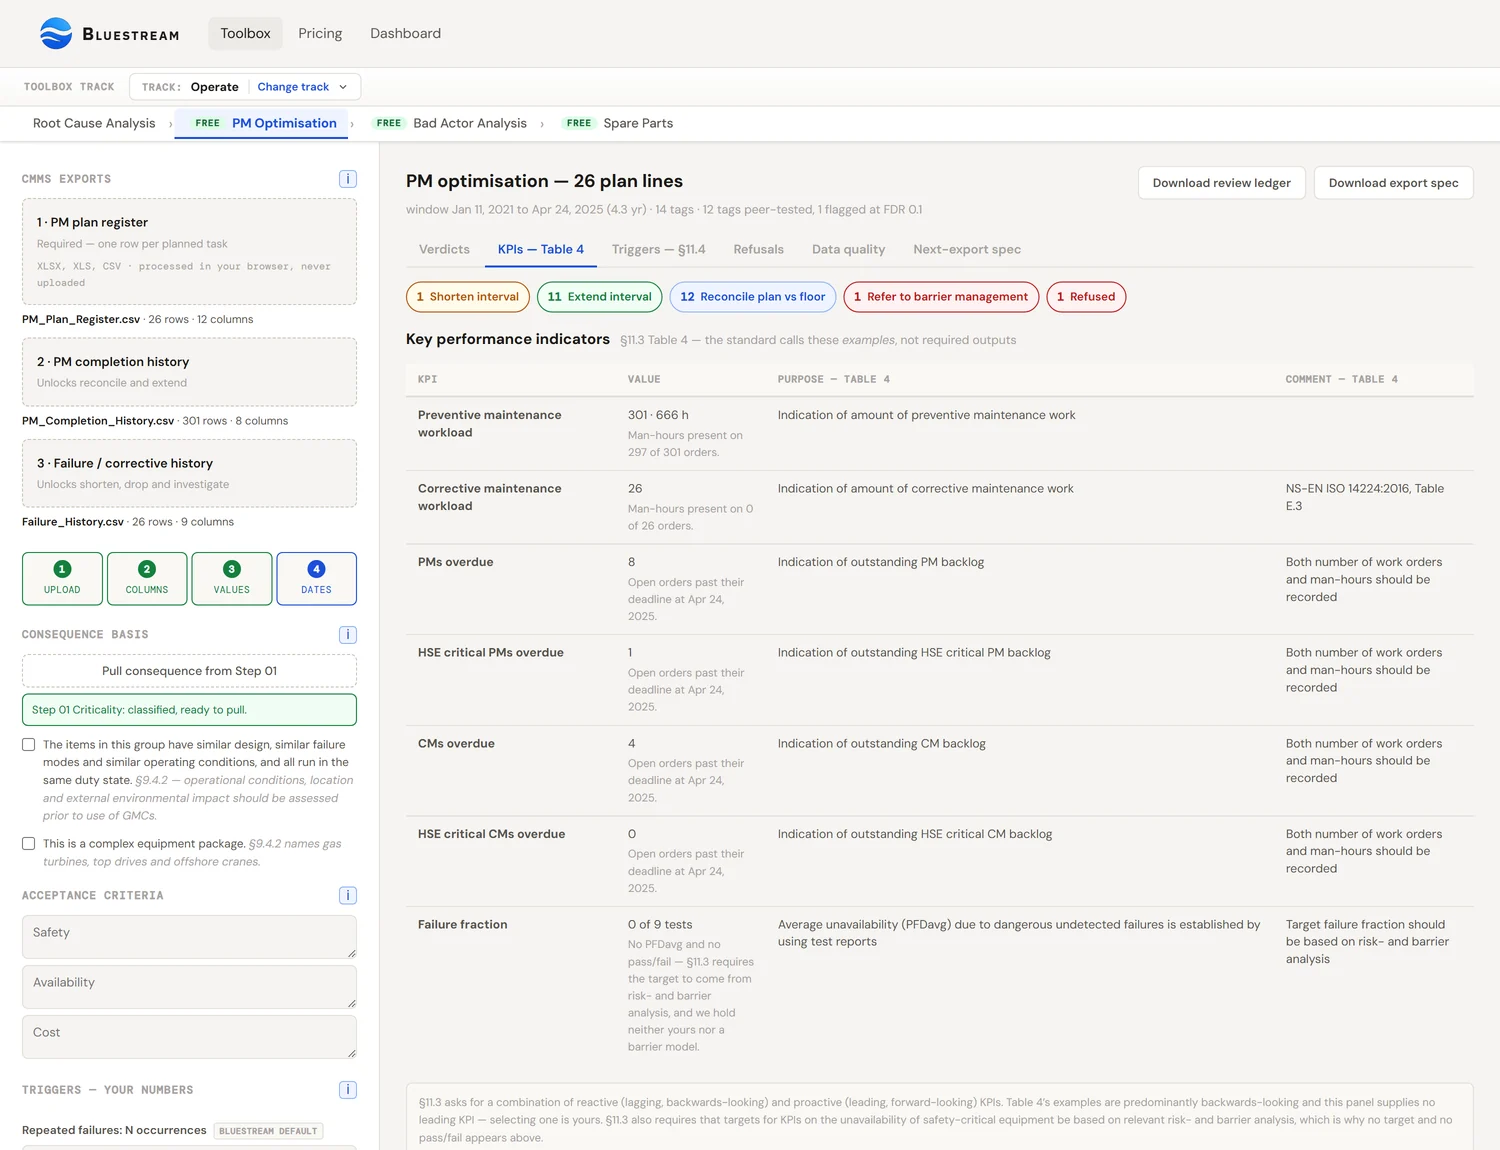
§11.3 also asks for a combination of lagging and leading indicators. Table 4’s examples are predominantly backwards-looking and the panel says so; choosing a leading one is yours to do.
Common mistakes
Treating a bulk close-out as execution
When four hundred orders are technically completed on three dates, the observed intervals stop describing the floor and start describing an administrative tidy-up. It flattens the gaps and raises apparent compliance at the same time, so a compliance threshold does not catch it — it is satisfied by it. The tool detects the pattern and refuses the verdicts that are built on completion gaps for that run.
Guessing the maintenance category
If PM01 and ZM2 are not mapped to preventive and corrective, a corrective order can end up counted as evidence that a preventive task is working. The tool asks you to map the values it actually found and blocks the PM/CM analyses until the mapping covers almost everything.
Shortening the wrong task
A tag that fails often is a tag, not a task. If the bearings are failing, shortening the seal inspection adds cost and infant mortality and removes no failure. Where the data supports task-level attribution the tool uses it, and where it does not, it says the verdict is at asset level and claims nothing finer.
Extending on an empty column
The commonest way to get a wrong answer out of a PM review is to read “no failures recorded” as “no failures”. Recording gaps are the norm in maintenance data. That is why limb A requires a comparison and limb B requires the condition field.
Getting the file from your CMMS
The three exports map onto standard transactions. Pull them for the same window and the same tag scope.
SAP PM
Three transactionsWhere each export comes from
IP24 — maintenance plans and items, for the plan register
IW39 — order list, filtered to your preventive order types
IW29 — notification list, which is where the damage and cause codes live
IW29 is the one worth arguing for. Orders carry what was done; notifications carry what was wrong, and the failure coding that decides whether a verdict can be attributed to a task at all comes from there.
IBM Maximo
Two applicationsWhere each export comes from
PM — the preventive maintenance application, for the plan register
WOTRACK — work order tracking, split by work type into the two histories
Both histories come out of the same application, so export it twice with the work type filter set differently rather than trying to separate preventive from corrective afterwards.
Microsoft Dynamics 365
Asset ManagementPath
Modules → Asset management → Inquiries
Maintenance plans give you the register; work orders give you both histories, separated by their maintenance type. Take the maintenance type as a column rather than filtering it away — the tool asks you to map the values it finds, and it cannot map a value that was filtered out before export.
Include the order status and a due or overdue date if you can. Without them the tool cannot tell which orders are still open, and the four overdue KPIs are refused rather than computed over closed history.
References
- NORSOK Z-008:2024, Risk based maintenance and consequence classification. Clause 9 (maintenance programme), Clause 11 (reporting, analysis and improvements). The clause references throughout this guide are to the 2024 edition.
- NS-EN ISO 14224:2016, Collection and exchange of reliability and maintenance data for equipment. The source of the Table 3 field list reprinted in Z-008 §11.2, and of the failure-mode coding the tool reads.
Next steps
PM optimisation is where the Operate track closes back onto Develop. A shorten verdict with no known cause belongs in Root Cause Analysis; a change of strategy belongs back in RCM; a task that should never have been on the plan belongs in the concept that generated it.