NORSOK Z-008:2024 Clause 12 turns spare-parts holding into a risk decision rather than a purchasing habit. The whole clause rests on two dimensions: the consequence of not having the part in place and the demand rate. Everything else — category, location, max/min, reorder level — hangs off those two.
Clause 12 is short and mostly permissive. There are exactly two “shall” sentences in it: 12.1 requires the spare-part assessment to be based on the consequence classification and other relevant analyses, and 12.5 requires capital spares to be identified case by case from a risk assessment. Almost everything else is should, can or may, and Annex C is informative. Knowing which is which is the difference between a defensible holding policy and an expensive opinion.
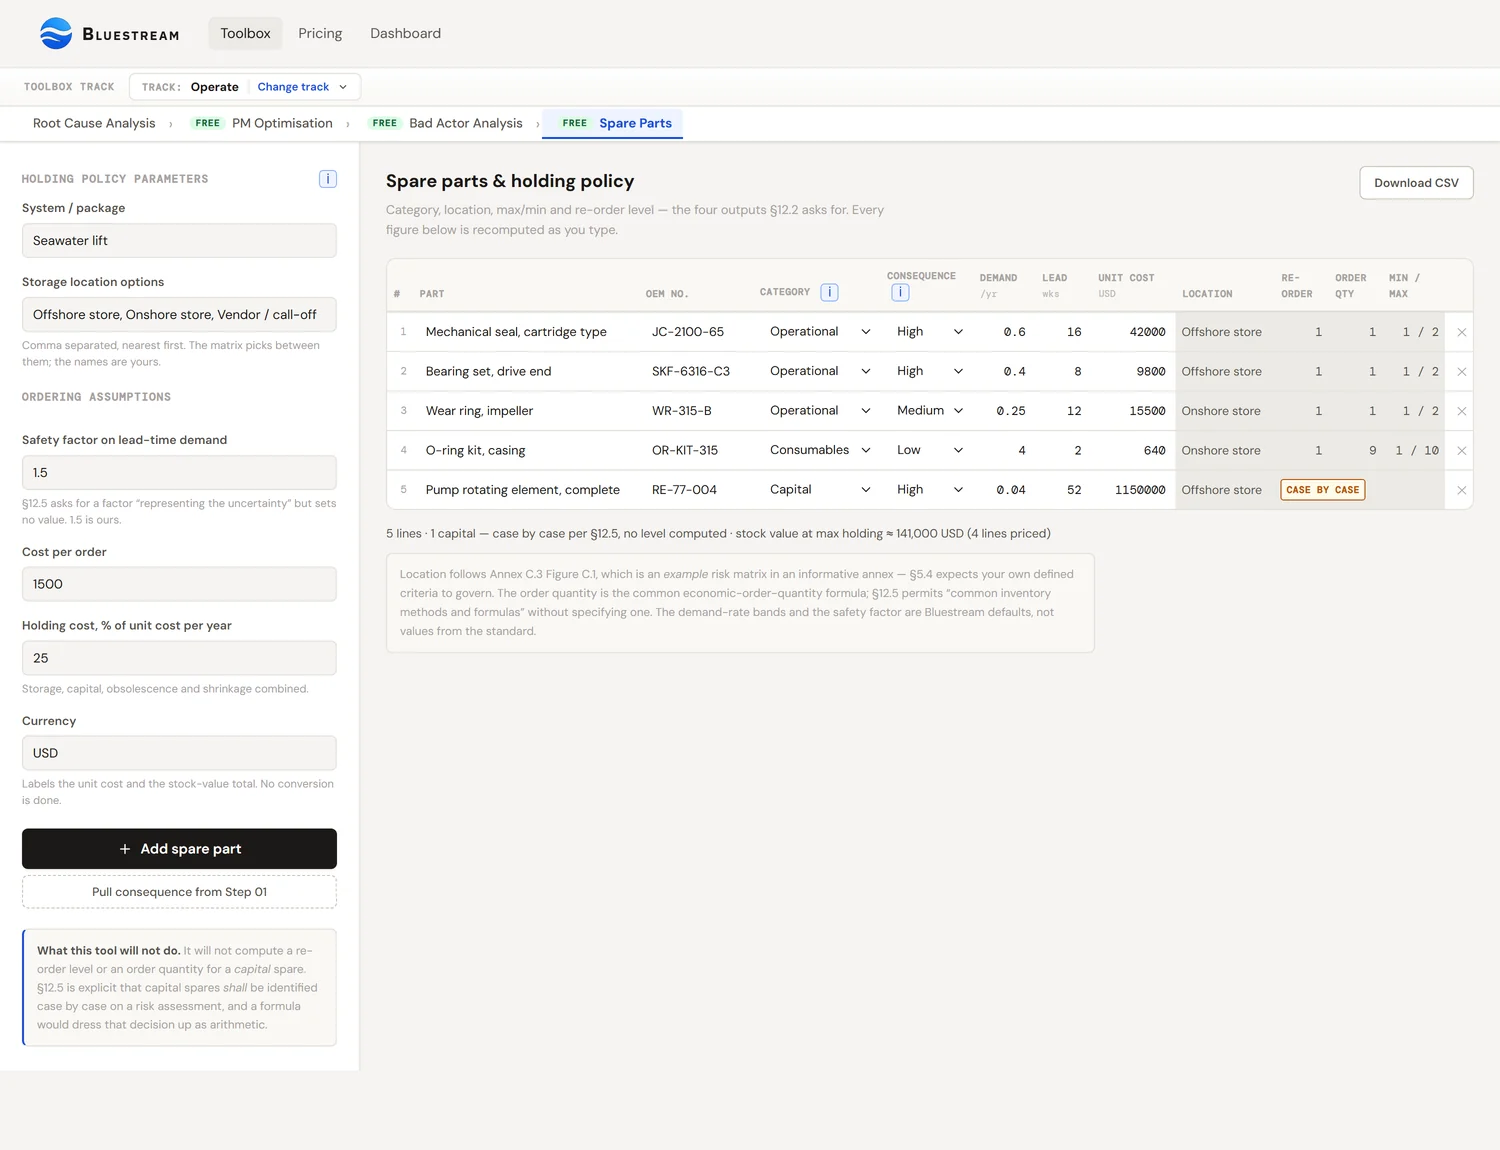
The tool is built. Spare Parts / Holding Policy is Tool 04 on the Operate track of the Bluestream Toolbox, and it is free. What follows is the method guide — the Z-008 spine behind it, which you can equally work through by hand or in a spreadsheet.
The two-sided cost of a shelf
Every spare on the shelf is a bet against downtime, and like any bet it has a cost on both sides:
- The cost of holding — capital tied up, warehousing, insurance, obsolescence, and the slow death of shelf life. A common figure is 15–30% of the part’s value per year, just to keep it sitting there. Across a large plant the MRO storeroom can be tens of millions of dollars.
- The cost of not holding — when the part isn’t there, a quick repair becomes an extended outage while you expedite, fabricate or wait. For a critical asset that lost-production cost can dwarf the part price a thousand-fold.
Good MRO management is the disciplined balancing of those two costs, item by item. The wrong answer in both directions is common: bloated stores full of obsolete parts and stockouts on the items that matter, because nothing was optimised — everything was bought “to be safe.”
What Clause 12 actually requires
Most spare-parts policies are inherited. Somebody stocked two of everything in 2009, the min/max got typed into the CMMS, and it has been reordering ever since. Z-008 does not ask you to justify the stock you have; it asks you to derive the stock you should have from an analysis you have already done.
The clause opens with its one binding sentence, and it is worth reading slowly because it names three separate things that have to be traceable:
“The spare part assessment defining the need for spare parts and the spare part strategy (number of, location and lead time) shall be based on results from the consequence classification (see Clause 8) and other relevant analyses like reliability analysis and barrier analysis (see 5.5 for more examples).”
NORSOK Z-008:2024, 12.1
Three deliverables, then: number of, location, lead time. And one mandatory input: the consequence classification from Clause 8. If your holding policy cannot show a line back to a consequence class per tag, it does not meet 12.1 — regardless of how good the arithmetic downstream is.
Here is the whole clause laid out by modal verb, so you can see how little of it is actually mandatory.
| Ref | Weight | What it binds |
|---|---|---|
| 12.1 | shall | The spare-part assessment and strategy (number, location, lead time) must be based on the consequence classification and other relevant analyses. |
| 12.1 | should | The work order should state the needed spare parts for the activity. |
| 12.2 | figure | Figure 7 gives the workflow. The outputs live in the figure, not in a requirement sentence. |
| 12.3 | can | Spare parts can be generally categorised into the four categories. The categories are not mandated. |
| 12.3 | should | Parts should be registered and uniquely identified in the maintenance management system by OEM equipment number. |
| 12.4 | should | Optimum location should be determined by a risk model with two dimensions: consequence of not having the part, and demand rate. |
| 12.4 | example | Annex C gives an example risk matrix. Annex C is informative. |
| 12.5 | can | Common inventory methods and formulas can be used — for operational spare parts and consumables. |
| 12.5 | shall | Capital spare parts shall be identified case by case based on a risk assessment. |
| 12.6 | may | Additive manufacturing may be considered as an option in spare-parts selection. |
Edition note, and it cuts both ways. In Z-008:2017, the location risk model was a shall; in 2024 it is a should. Meanwhile capital spares moved the other way — 2017 said they “are evaluated case by case”, a statement of practice, while 2024 says they “shall be identified case by case based on a risk assessment”. If you are working to a legacy 2017 procedure, the obligations are not where you left them. Z-008:2017 was superseded on 20 December 2024.
The requirements that live outside Clause 12
Clause 12 is not the whole spare-parts story in Z-008. Three sentences elsewhere in the standard bear directly on holding policy and are easy to miss:
- 6.8 Materials adds two dimensions Clause 12 never mentions: spare-part availability “shall be optimized based on demand, consequence of failure, repair time and cost, and linked to the maintenance planning activity”. Repair time matters because a part you can fit in four hours and a part that needs a two-week outage are not the same holding problem, even at the same criticality.
- 8.3, Table 1, step 5 runs the other way and is a constraint on the input: when performing the consequence classification, “other mitigating actions shall not be considered at this stage, i.e. spare parts, manning, and tools”. Criticality is assessed blind to what is in the warehouse. That keeps the input to Clause 12 clean, and it means the flow is strictly one-directional: classification feeds spares, spares never feed back into classification.
- 9.2.3 makes the linkage operational: a work order shall, as a minimum, contain “required spare parts and resources” among its fields.
The Clause 12 workflow
Figure 7 in 12.2 lays out the process. It is worth reproducing because it shows what the clause considers an input, what it considers a step, and — importantly — what it considers an output, since some of those outputs get no supporting text anywhere else in the clause.
Max/min has no method behind it in Z-008. It is listed as an output of Figure 7 and then never mentioned again. If a procedure, a consultant or a piece of software hands you max/min levels and calls them Z-008 compliant, that is a house rule wearing a standard's badge. Set them if you need them — most CMMS packages demand a number — but document them as your own convention, not as a clause requirement.
The four categories
12.3 says spare parts can be generally categorised as follows. That is a can, not a shall — but the category is worth treating as a first-class field anyway, because it decides which route the part takes in 12.5. Get the category wrong and you apply the wrong method.
These are the standard's own defining words, verbatim, followed by what each one looks like on a real pump train.
Capital spare parts
Three characteristics, all three of them:
“vital to the function of the plant but unlikely to suffer a fault during the lifetime of the equipment; delivered with unacceptably long lead time from the supplier and usually very expensive; characterised by a substantially lower cost if they are included with the initial order of the system package.”
On a pump train: the complete spare rotor assembly for the 6.6 kV drive motor. Forty-week lead time from the OEM, six figures, and — the tell — roughly a third cheaper if it goes onto the original purchase order with the motor itself than if it is ordered as a one-off in year seven. That last clause is the giveaway that capital spares are fundamentally a procurement-timing decision, usually made during design, not during operations.
Operational spare parts
“spare parts required to maintain the operational and safety capabilities of the equipment during its normal operational lifetime.”
On a pump train: the mechanical seal cartridge, the bearing set, the coupling elements, the seal-support-system instrumentation. These are the parts the PM programme consumes on a schedule and the parts corrective work reaches for. They have a demand rate you can actually estimate, and they are the only category (with consumables) that 12.5 lets you put through inventory formulas.
Consumables
“item or material that is not item-specific and intended for use only once (non-repairable).”
On a pump train: gaskets, O-rings, lube oil, oil-filter elements, bearing grease, thread-locking compound, shim stock. Note “not item-specific” — the same gasket serves twenty tags, which means the demand rate is a fleet number, not a tag number, and it is usually the easiest number in the whole exercise to estimate.
Insurance spare parts
“spare parts which are not identified as required during the lifetime of the item but if unavailable, could lead to an unacceptable downtime.”
On a pump train: the fabricated pump casing. Nobody plans to replace a casing. But if it cracks — cavitation damage, a bad hydrotest after a modification, a foreign object — the replacement is a thirty-week fabrication and the plant is down for all of it. You hold it against the consequence, not against a demand rate, because the demand rate is essentially zero.
Capital or insurance? The standard leaves this open
Both definitions describe a long-lead, rarely-consumed, high-downtime-consequence part. Z-008:2024 split them into two categories — the 2017 edition listed three and treated capital and insurance spares as the same thing under two names — but it did not supply a tie-break rule. You need one, because they are bought at different times, by different people, out of different budgets.
Bluestream's tie-break rule (ours, not the standard's)
Capital is a procurement-timing decision. The defining feature is the third bullet: substantially cheaper if bought with the original package. That makes it a design- and project-phase question, and if you did not buy it with the package you have already lost the saving. Owner: the project.
Insurance is a pure risk decision. There is no expectation of needing it and no procurement saving to chase; you are buying down an availability exposure with cash. That makes it an operations-phase question, revisited whenever the consequence or the lead time changes. Owner: the asset or reliability engineer.
In practice a part can start as capital in the project and be re-argued as insurance ten years later. Record which one it is and why — 12.5's risk-assessment requirement applies to capital spares by name, and we recommend routing insurance spares the same way for the simple reason that the standard offers no arithmetic alternative for them.
The one identity rule in the clause. 12.3 closes with a should: parts from different vendors and suppliers “should be registered and uniquely identified in the maintenance management system by using the OEM equipment number”. It sounds like bookkeeping. It is the reason a fleet-wide demand rate is computable at all — without a single identity per physical part, the same seal appears as six different stock codes across six tags and every demand estimate is wrong by a factor of six.
12.4's risk model: two dimensions, and only two
This is the analytical core of the clause, and it is one sentence:
“Determining the optimum location for a spare part should be done by use of a risk model where the dimensions are the consequence of not having the spare parts in place and the demand rate.”
NORSOK Z-008:2024, 12.4
Why this is not the asset's criticality class
The most common mistake in the whole clause is to reach for the Clause 8 dominant class and use it as the consequence axis. That is not what 12.4 asks for, and the difference is not pedantic.
Clause 8 asks: what happens if this function fails? Clause 12.4 asks: what happens if this function fails and the part is not on the shelf? Those are different questions, and the second one is conditioned on things Clause 8 was explicitly forbidden to consider — 8.3's Table 1, step 5 bars spares, manning and tools from the classification.
Consider a C3 pump on a critical duty with an installed spare (RED-B). The function consequence is high — that is why it is C3. But the consequence of not holding a spare seal is that the B pump carries the duty while you wait, and the exposure is a period of lost redundancy, not lost production. Meanwhile a C2 filter housing with no redundancy at all and a sixteen-week lead time can carry a worse not-having-it consequence than the C3 pump does.
The clause anticipates this. It says the consequence of not having the part “can be established for this purpose or by use of the functional classification, see Clause 8”. The Clause 8 class is offered as an option, not as the definition. Annex C.3 repeats the point: “Input from the consequence classification can be used or modified for this purpose.”
The consequence scale Annex C offers
Annex C.3 gives an example three-level scale for exactly this purpose. It is informative, and it is worth quoting because of what defines the middle level:
| Consequence | Description (Table C.4, verbatim) |
|---|---|
| High | “Equipment of a system that shall operate in order to maintain operational capability in terms of safety, environment and production.” |
| Medium | “Equipment of a system that has installed redundancy, of which either the system or its installed spare shall operate in order to maintain operational capability in terms of safety, environment and production.” |
| Low | “No consequence for safety, production or the environment.” |
Read Medium again. It is not a lower functional consequence — the wording is the same as High. It is the same consequence with installed redundancy in front of it. That is a structurally different axis from Clause 8's C1/C2/C3, and it is the reason you cannot simply relabel the dominant class and call it done.
It is also, conveniently, computable from what a Z-008 criticality assessment already holds, because Z-008 records redundancy separately from consequence:
| Redundancy (Table C.2) | Definition | Maps to Table C.4 as |
|---|---|---|
| A | “No redundancy, i.e. the entire system is required to avoid any loss of function.” | High, if the function consequence is high |
| B | “One parallel unit can suffer a fault without influencing the function.” | Medium |
| C | “Two or more parallel units can suffer a fault at the same time without influencing the function.” | Medium, or Low with justification |
Two cautions on that mapping. It is ours, not the standard's — Annex C is informative and explicitly invites modification. And it must stay overridable, because redundancy that exists for safety reasons (a second relief path, a redundant shutdown element) should not be credited as availability redundancy here any more than it should be in Clause 8.
The demand-rate axis: bands, not decimals
The second dimension is the demand rate, and Z-008 gives you permission to be coarse about it. Annex C.4, discussing failure frequency, says the plain thing that most inventory literature will not:
“However, for practical purposes, it is often better to use qualitative data and expert judgements to set an expected failure frequency, like 2-5 years, 5-10 years, etc., especially for new installations or items where there is little data available to establish a quantitative failure frequency.”
That sentence licenses a banded demand axis. Three or four bands — several per year, every 2–5 years, every 5–10 years, never expected — are enough to place a part on a location grid, and they do not require a failure rate you cannot honestly source. A banded axis you can defend beats a decimal you invented.
Why the bottom-left cells break the pattern. A part that is critical and almost never used is the one case where inventory arithmetic actively misleads — see the EOQ discussion below. The standard resolves this by routing capital spares out of the formulas entirely and into a case-by-case risk assessment (12.5). The grid should do the same rather than pretending a matrix cell can answer it.
Where the demand rate comes from
Everything downstream needs a demand rate, and 12.1 is unusually candid about how hard half of it is. Two sentences, and they are not symmetrical:
“The PM program gives the type and estimate of the demand rate for spare parts used for PM. The demand rate and which spare parts are needed for corrective maintenance are more challenging to estimate.”
PM demand: arithmetic, not estimation
Preventive demand is a multiplication. For each maintainable item, each PM task on that item, and each part the task consumes:
“Tasks per year” is 1 ÷ the PM interval. If a maintenance concept says replace mechanical seal, 24 months across six identical pumps, that is 6 ÷ 2 = 3 seals per year, before any corrective demand. The only piece of data this needs that a maintenance concept does not usually carry is units per task — the parts list on the job. That is the single highest-value field to add to a PM programme if you want computable spares demand, and Z-008 supports adding it: 9.1 says the maintenance programme should include “necessary spare parts and tools per item”, and 9.4.2 says spare parts can be added to the generic maintenance concept.
Corrective demand: the hard one
Corrective demand is a failure rate, and 12.1 names four sources for it in a deliberate order:
- Historical maintenance and inventory transactions. Named first, and rightly — your own transaction history is the only source that reflects your duty, your climate and your operating discipline. Note that it is two data sets: maintenance history tells you how often things broke, inventory transactions tell you what was actually issued to fix them. Most plants can produce the first and struggle to produce the second, and a spares policy built on failure counts alone will systematically miss the parts consumed during work that was never coded as a failure.
- Installation-specific data. Same equipment elsewhere on the same site, same service.
- Generic reliability data, e.g. OREDA®. Z-008 names OREDA explicitly. It is the right instinct and it comes with two practical catches. OREDA is a licensed commercial dataset — it is not free to redistribute, and a tool that quotes OREDA numbers at you without a licence is a problem, not a feature. And OREDA's taxonomy is equipment-class level, so it gives you failure rates per failure mode, not per part number. Getting from “centrifugal pump, external leakage — process medium, x per 106 hours” to “seal cartridges per year” requires you to supply the mapping. See the OREDA guide for what the dataset does and does not contain.
- Vendor and maintenance personnel experience. Last in the list, and the one everyone actually uses. Treat it as legitimate — Annex C.4 explicitly prefers expert judgement over a fabricated quantitative rate — but capture it as a structured judgement with a named owner, a date and a written rationale, the same way you would document a consequence override.
Do not confuse a failure rate with a parts rate. Not every failure consumes the part you are stocking, and some failures consume several. A seal failure consumes one seal cartridge, but it may also consume a shaft sleeve, a set of bearings and forty litres of oil. Going from failure modes to part numbers is a mapping step, and it is where a well-run FMECA earns its keep.
Reorder point and order quantity
Clause 12.5 names the parameters and stops there: the reorder level follows from “demand rate and delivery time, adjusted by a safety factor representing the uncertainty”, and the order quantity from “demand rate, cost per order, and holding cost”. It does not give formulas, and it does not need to — those are ordinary inventory practice, and the two sections below are the working versions. What Clause 12 contributes is everything upstream: knowing which parts these formulas should be pointed at, and which ones they cannot answer for at all.
How much to order: EOQ
For a regularly-consumed item, the economic order quantity finds the order size that minimises the sum of two opposing costs: order in big batches and you order rarely (low ordering cost) but carry a lot (high holding cost); order in dribs and you carry little but order constantly. The minimum sits where they cross:
The model below draws that U-shaped total-cost curve and marks the EOQ — note how forgiving the bottom is.
When to order: reorder point & safety stock
Ordering the right quantity is useless if you order too late. The reorder point (ROP) is the stock level that triggers a new order — set so that, on average, stock runs down to the safety-stock cushion just as the new delivery arrives:
Service level is the dial. Choosing 95% vs 99% vs 99.9% availability directly sets z, and the safety stock — and cost — climb steeply for each extra nine, exactly like the availability nines. You buy high service levels only where the stockout consequence justifies it. Set the dials and watch EOQ, the reorder point and the cost trade-off move:
Interactive — Inventory optimisation
Live modelTotal annual cost vs order quantity
EOQ=√(2DS/H) with H = unit cost × 25%/yr carrying; SS=z·σ·√(LT/52) where σ = variability × weekly demand and z from the service level (inverse-normal); ROP = D·(LT/52) + SS; annual cost = S·D/EOQ + H·EOQ/2 + H·SS. Assumes a continuous-review (Q,r) policy with normal demand — illustrative of the trade-offs, not a stocking decision.When the formulas don’t apply: insurance spares
The EOQ/reorder machinery assumes a part is consumed often enough to have a demand rate. Many of the most important spares aren’t: a spare rotor for a single critical compressor might fail once a decade, cost a fortune, and take a year to manufacture. Demand-based maths says hold none. Risk says otherwise. These are insurance (capital) spares, and they’re stocked on a different basis entirely:
This is why spare-parts stocking must be driven by criticality, not by part price or usage alone. A cheap, fast-moving bearing and a million-dollar, never-moving rotor need opposite strategies. The usual approach segments the storeroom:
- Consumable / fast-moving — pure EOQ and reorder-point optimisation (often vendor-managed or min/max).
- Slow-moving but predictable — reorder point with carefully chosen service level by criticality.
- Critical insurance spares — risk-based decision per item; pooling across sites or OEM stocking agreements to share the cost.
- Obsolete / dead stock — actively identified and disposed; the silent killer of MRO budgets.
The standards-driven route. NORSOK Z-008:2024 Clause 12 makes the spare-parts assessment normative and ties it to the consequence classification — category, location, max/min and re-order level all follow from it. See Spare parts & holding policy for that method; the formulas below are what it points at once the method has told you where they apply.
MRO is the bridge between reliability and the storeroom. The demand rate that feeds EOQ comes from failure-rate and history data; the service level you choose per item should track its criticality; and the whole thing lives in the CMMS, where the bill of materials links parts to assets and reservations to planned work. A kitted, parts-ready job is impossible without it — which is why MRO and planning are two halves of the same discipline Bluestream implements.
Capital spares: the one hard obligation
Everything above was can and should. This one is not:
“Capital spare parts shall be identified case by case based on a risk assessment, resulting in a list of spare parts which represents the minimum combination of cost and risks.”
NORSOK Z-008:2024, 12.5
Read the three parts of that sentence carefully, because each one constrains you.
- “case by case” rules out a policy. You cannot satisfy this with a rule like “hold one spare for every C3 machine over 500 kW”, however sensible that rule is. Each part gets its own assessment.
- “based on a risk assessment” rules out a formula. The output of an EOQ calculation is not a risk assessment, and neither is a matrix cell.
- “a list … which represents the minimum combination of cost and risks” makes the set the deliverable, not just the individual decisions. You are being asked to justify the portfolio: this collection of capital spares, at this total cost, buys down this much exposure, and no cheaper collection buys down as much.
Practically, that means a decision record per capital spare, and it needs to survive a reader who was not in the room:
- Part identity, by OEM equipment number (12.3), and the tags it serves
- The consequence of not having it: what is lost, for how long, in safety, environment and production terms
- Lead time, split into procurement and transport (12.1), with the source and date of the quote
- Repair time once the part is in hand (6.8) — a four-week fabrication and a four-hour swap are different exposures
- The exposure calculation: downtime cost, or the risk reduction if the consequence is safety or environmental
- Purchase cost now versus purchase cost later, including the with-the-package saving that defines the category
- Which analyses were consulted — reliability analysis, barrier analysis, RBI (12.1 requires this linkage)
- The decision, the owner, the date, and the review trigger
What an auditor will actually check. Not your EOQ. They will pick three parts off your holding list and ask you to show the line back to the consequence classification, per 12.1. Then they will ask for the risk assessment behind a capital spare, per 12.5. Those two are the compliance core of Clause 12. The arithmetic in between is your business.
Where this fits in the chain
Spares assessment is a downstream consumer. It is the last analysis in the Z-008 sequence that still says something about the physical asset, and almost everything it needs was produced by a step you have already done.
| Clause 12 needs | Produced by | What carries across |
|---|---|---|
| Consequence classification 12.1 shall · 12.4 · Figure 7 | Criticality Classification Z-008 §8.3 | Dominant class per tag (C1/C2/C3), the category that drove it, and the redundancy rating A/B/C. The redundancy is what makes Table C.4's Medium computable. |
| Failure modes and their frequency | FMECA | The failure modes to price parts against, and the failure-rate estimate per mode. Annex C.4 explicitly allows this to be a qualitative band. |
| Which modes run to failure | RCM | A run-to-failure decision is a corrective demand forecast. Modes assigned RTF generate the CM half of the demand rate. |
| PM demand rate 12.1 · Figure 7 · Clause 9 | Concept Builder | Task, interval and maintainable item. What is still missing is units per task — until the parts list is attached to the task, the PM demand rate cannot be computed, and this is the one demand source Z-008 calls straightforward. |
| Historical failure counts 12.1, first-named source | Bad Actor analysis | Observed failures per asset, model and cause from CMMS history. Note this gives you failures, not parts issued — the inventory-transaction half of 12.1's sentence needs a separate export from stores. |
| Barrier and reliability analyses 12.1 shall | Outside the maintenance chain | Barrier strategy, SIL assessments and RBI reports are analyst-supplied. Record which analysis was consulted and its revision; that reference is part of what 12.1 requires. |
The flow only runs one way. Z-008 §8.3 Table 1, step 5 forbids crediting spare parts when performing the consequence classification. So the classification is a clean input to Clause 12, and a spares assessment must never write back into it. If your holding policy has started to influence your criticality ratings, something has gone wrong upstream.
What ISO 14224 contributes
If you want the demand data to be there next year, the data model matters. ISO 14224:2016 Table 8 (Maintenance data) already standardises three fields that Clause 12 depends on, and most CMMS configurations leave two of them empty:
- Spare part location — “availability of spares (e.g. local/distant, manufacturer)”. This is the Clause 12.4 output, recorded per maintenance event.
- Maintenance delays/problems — “prolonged down time causes, e.g. logistics, weather, scaffolding, lack of spares, delay of repair crew”. This is the only field in common use that records a stock-out actually costing you something. Without it you cannot evidence that a holding policy is too lean.
- Active maintenance time and down time — both marked in Table 8 as minimum data to be collected. These give 6.8's “repair time” dimension, and the difference between them is where logistics delay hides.
Configuring those three fields properly is worth more to a future spares assessment than any amount of modelling on data you do not have.
What the method cannot tell you
Clause 12 is four pages long and it leaves a good deal open. Knowing the edges keeps you from over-claiming.
- It cannot set max/min levels. They are named as an output in Figure 7 and given no method anywhere in the clause. Any max/min rule is yours.
- It cannot tell capital from insurance. The 2024 edition split the categories and left the definitions overlapping. The tie-break above is Bluestream's, and so is anyone else's.
- It cannot give you a demand rate without a bill of materials. Figure 7's first input is the spare part list. If you do not know which parts a job consumes, there is nothing for the method to operate on. This is the most common reason a spares assessment stalls, and it is a data problem, not an analysis problem.
- It cannot supply failure rates. 12.1 names OREDA as a source; it does not give you a licence to one, and generic data is equipment-class level, not part-number level. Annex C.4's qualitative bands are the honest default when you have neither.
- It cannot price a stock-out. Every service-level decision needs a downtime cost or a risk tolerance, and both come from the business, not from the maintenance analysis.
- It says nothing about obsolescence or shelf life. Annex E mentions shelf-life and longevity among criteria that may be included in spare-part selection, informatively, and that is the extent of it. A twenty-year insurance spare with elastomers in it is a problem the clause does not address.
- It says nothing about pooling. Whether a neighbouring operator, an OEM consignment stock or a regional pool counts toward your holding is a commercial arrangement outside the standard's scope, even though it can dominate the answer.
- It says nothing about repair versus replace. A rotor that can be refurbished in eight weeks changes the whole calculation for the spare, and neither the categories nor the formulas have a place to put that.
- Its own example matrix is informative. Annex C is informative in full, and 12.4 is a should in the 2024 edition where it was a shall in 2017. Do not present the risk matrix as mandatory; it is not.
- Additive manufacturing is signposted, not specified. 12.6 says AM may be considered and points at three external documents for qualification. Those are bibliography references; Bluestream does not hold them and this guide makes no claim about their content.
References
- NORSOK Z-008:2024, Risk based maintenance and consequence classification, 20 December 2024. Particularly Clause 12 (12.1 General, 12.2 Work flow and Figure 7, 12.3 Spare part categories, 12.4 Location and holding, 12.5 Reorder level and order quantity, 12.6 Additive manufacturing); 6.8 (Materials); 8.3 Table 1 step 5; 9.2.3 (work order content); Annex C (informative) C.2, C.3 Table C.4 and C.4; Annex E (informative).
- NORSOK Z-008:2017, the previous edition, superseded 20 December 2024. Cited here only for the two edition deltas noted above: the location risk model was a shall, and capital spares were a statement rather than a requirement.
- NS-EN ISO 14224:2016, Collection and exchange of reliability and maintenance data for equipment, Table 8 (Maintenance data) for the spare-part location, maintenance-delay and maintenance-time fields.
- Ordinary inventory practice for EOQ, reorder point, safety stock and service level. These are general operations-research methods that Z-008 12.5 permits but does not specify, and they are not attributable to any standard cited here. See the Spare Parts & MRO Optimization guide for the arithmetic in depth, including the holding-versus-stockout trade-off.
On what is not cited. Clause 12.6 points at three external documents for additive-manufacturing qualification. They are bibliography entries, they are informative, and Bluestream does not hold copies. They are named here for completeness of the clause map and nothing on this page describes their content.